
Last Updated on: 2nd August 2023, 03:38 pm
Are you considering moving to San Luis Obispo? One of the first questions you may have ahead of life in SLO Wine Country is how much it costs to live in the area.
With California’s notoriously high cost of living, it’s no surprise that beautiful SLO with its beaches and vineyards comes with steep living expenses. In fact, San Luis Obispo was recently named the second least affordable small metro area in the U.S. The only small metro more expensive is Napa in Northern California’s Napa Valley Wine Country.
Of course, you may consider the high San Luis Obispo cost of living a fair trade-off to live in one of America’s happiest cities!
Here’s what you should know about the cost of living in San Luis Obispo ahead of settling down in the area.
Table of Contents
San Luis Obispo Cost of Living Index (COLI)
San Luis Obispo is expensive, even for California. The San Luis Obispo cost of living index (COLI) is 164 which makes it 64% more expensive than the national average. By comparison, the California cost of living is 50% higher than the national average.
Some living expenses are actually fairly affordable – healthcare and San Luis Obispo utilities are about 5% below the national average and transportation is 16% lower. However, SLO groceries are 10% higher than the national average and the housing index is 317.
Another way to understand the San Luis Obispo cost of living is by checking the Consumer Price Index (CPI). This measures inflation by tracking the average prices paid by consumers for services and goods.
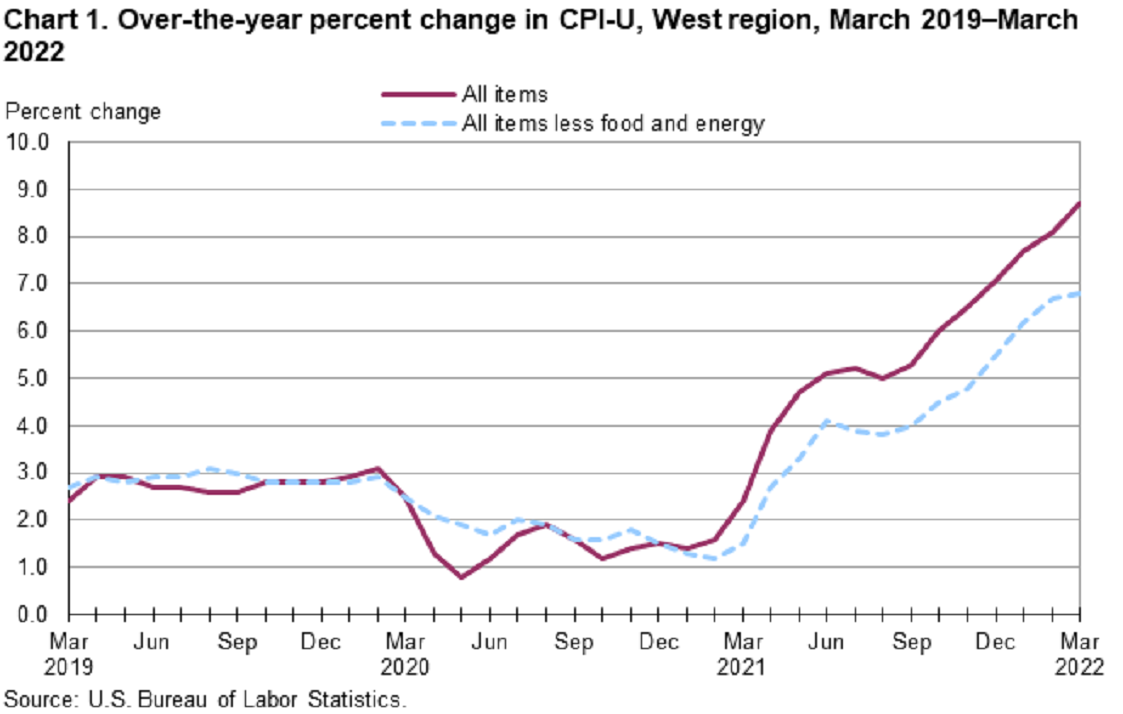
The CPI for the Pacific area of the West was recently up 8.1% year-over-year compared to 8.7% for the entire West region and 8.5% for the average U.S. city.
Here’s how the CPI-U for urban consumers breaks down:
- Average U.S. city: 287.5
- Pacific West including California: 117.7
- Los Angeles metro area: 306.7
- San Francisco metro area: 320.2
Energy prices in the West have climbed 33% in the last 12 months, a common trend across the U.S., while food prices rose 8.9%. The Consumer Price Index for the West had its largest 12-month increase since 1982.
Average San Luis Obispo Household Budget
How much do you need to earn to live in San Luis Obispo? There are a few ways to answer this question.
The Consumer Expenditure Survey (CE) is helpful for understanding how much you need to earn to live in San Luis Obispo for a year. This survey tells you the average annual expenditures for households in the area.
The most recent CE Survey was 2019. The average California income before taxes was $93,899 and the average household spent $70,482 per year. Here’s how the average household budget broke down:
- Housing: $25,730
- Shelter: $17,146
- Utilities: $3,996
- Household furnishings: $1,958
- Transportation: $10,276
- Personal insurance and pensions: $8,525
- Food: $9,465 ($5,081 at home)
- Healthcare: $4,772
- Entertainment: $3,289
- Education: $1,546
You can also use the Family Budget Calculator from the Economic Policy Institute. This cost of living calculator for San Luis Obispo estimates your monthly living expenses based on the makeup of your household.
The average household with two adults and two kids would need $8,731 per month or $104,773 per year to afford a modest lifestyle in the San Luis Obispo metro area.
This calculator estimates $1,240 in monthly child care costs and $1,665 for housing – your actual living expenses may be very different.
By comparison, the cost of living in California per month is $6,329 for a two-working-parent family according to the California Budget & Policy Center.
Cost of Groceries, Gas & Household Items in San Luis Obispo
Housing often gets the most attention when you consider whether an area is expensive or affordable, but don’t forget most of your income will be spent on other things like transportation, food, utilities, and entertainment. Compare the average price you will pay for common goods and services in San Luis Obispo with what you pay now.
- Milk (1 gallon): $3.76
- Eggs (1 dozen): $3.58
- Bread (one loaf): $3.64
- Chicken breast (1 lb): $5.31
- Three-course meal for two at a mid-range restaurant: $75
- Car insurance premium: $163/month
- Average SLO utilities bill: $234
- Average car loan payment: $474
- Average satellite/cable bill: $138
- Average cell phone bill: $95
- SLO Transit 31-day pass: $40 ($20 for seniors)
Remember that the average household in California spent $9,465 per year on food, more than half of it spent on groceries, while $3,996 per year ($333) was spent on utilities. This does not account for the dramatic increase in food and energy prices.
A recent report by Doxo, a bill pay service, found San Luis Obispo County households pay 27% more on bills than the U.S. average. The average SLO household pays $2,557 per month on bills compared to the U.S. average of $2,003. SLO County was ranked 29th out of 914 cities and metro areas – but it’s actually less expensive than the typical California city!
California city residents pay $112 more on average for bills than SLO residents. San Jose, the most expensive metro area, has average household bills of $3,151 per month.
You can expect to spend about 53% of your household income on bills.
San Luis Obispo Real Estate & Housing Market
Expensive San Luis Obispo real estate is the biggest factor that makes SLO an expensive place to live.
The median price for San Luis Obispo homes for sale is $882,000 according to Redfin. That’s up 18.9% year-over-year. Housing is in short supply in this hot market where homes sell after 7 median days on market. The average SLO home sells for 7% over list price!
The median price for a single-family home is $1.1 million in SLO while the median price for a condo is $565,000. Townhomes are a more affordable alternative to a house with a median sales price of $728,000, but that’s still well above the national average and even the CA median.

According to Doxo, the average mortgage payment in SLO is $3,870, nearly three times the national average of $1,368.
A new California housing rule means San Luis Obispo County must plan to add about 11,000 new homes, about half of which must be “affordable.” The new units do not need to be built but failing to make a plan means the county can lose state funds.
Is it more affordable to buy a house or rent in San Luis Obispo, CA?
Owning a home is more expensive than renting in San Luis Obispo – and almost all metro areas of California for that matter. The 2022 Rental Affordability Report from ATTOM used BLS wage data, HUD fair market rent data, and public sales information. They found the average home would require 87% of the average monthly income!
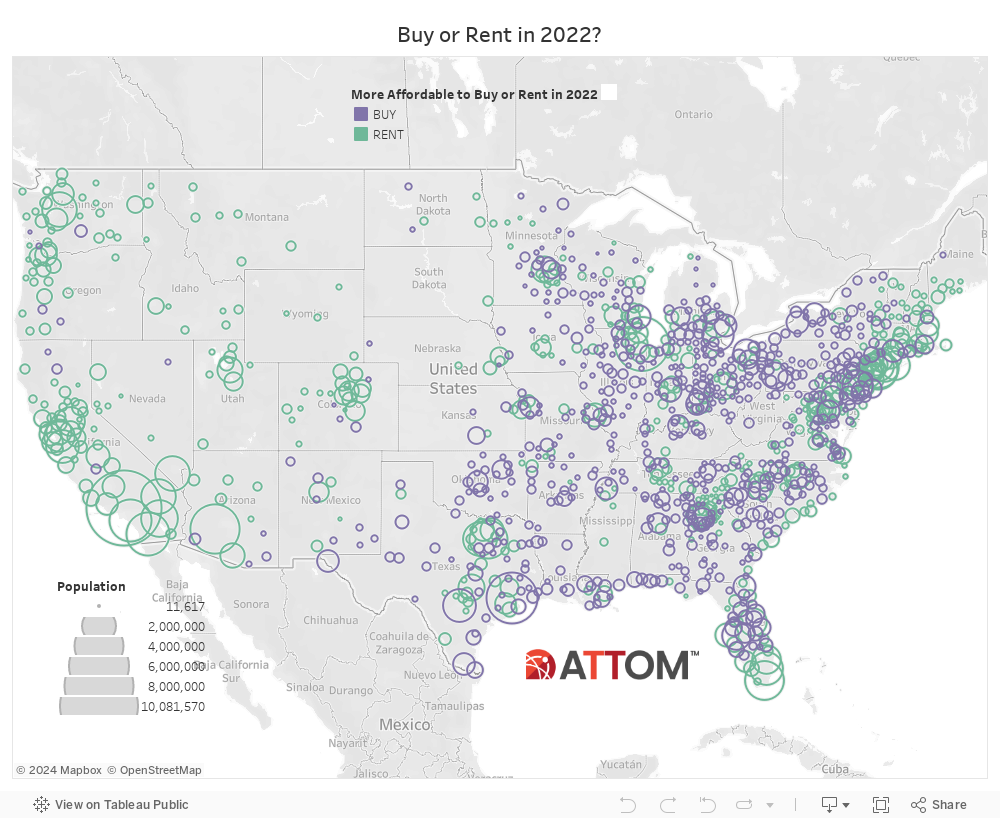
The San Luis Obispo price-to-rent ratio is 30.15. Calculated by dividing the median home price by the annual mean rent, that means it would take 30 years of paying typical rent to equal the price of a typical home. A ratio over 20 usually means the market is much better for renters than buyers.
Average Rent in San Luis Obispo & SLO Rental Market
How much does it cost to rent in San Luis Obispo? About 60% of SLO residents are renters compared to about 45% nationwide and in California. That’s no surprise given high San Luis Obispo home prices, but rent is still high in the city.
Doxo Insights reports the average San Luis Obispo rent is $2,439 based on automatic payments of its users. By comparison, the average national rent is $1,129. Doxo’s average is based on data from 6 million customers paying over 100,000 bill providers.
RentCafe reports the rent in San Luis Obispo is $2,347 on average, a very close figure. Their average is based on data from Yardi Matrix which provides nationwide research reports and is part of the Yardi family of property management software used by over 20,000 apartment buildings and landlords. By comparison, the national average rent is $1,628 according to RentCafe’s data.
San Luis Obispo Median Income & Average Salary
The area median income in San Luis Obispo County was $87,500 in 2019 for a family of four, according to HUD. The median household income is $58,550 in San Luis Obispo, lower than the metro area and California median of $78,700.
According to the BLS, the average wage in the San Luis Obispo metro area is $27.09, nearly the same as the U.S. average. However, many industries have higher-than-average wages including engineering and architecture, tech, community and social service, healthcare, construction, and protective services.
The most common occupations include:
- Government
- Transportation and utilities
- Leisure and hospitality
- Education
- Healthcare
Here’s what you can expect to earn in popular high wage occupations in SLO:
- Psychiatrist: $130/hour
- Other physicians: $133/hour
- Dentist: $95/hour
- Personal financial advisor: $80/hour
- Computer and Information Systems Manager: $78/hour
The average weekly wage in San Luis Obispo was $1,071 for the 3rd quarter of 2021.
San Luis Obispo Taxes: Property, Income & Sales Tax
SLO County tax plays a big role in the San Luis Obispo cost of living, but they’re often overlooked. Given that California is known for its high tax rates, make sure you’re braced for costly San Luis Obispo County taxes.
San Luis Obispo Property Tax
San Luis Obispo County property taxes are assessed at $1.03515 to $1.17303 per $100 of your home’s full value. These tax rates cover the entire SLO County, and your rate will depend on where you live, such as whether you are in the incorporated city of San Luis Obispo and your school district.
The city of San Luis Obispo property tax rate is $1.06225 per $100 of value for 2021/2022.
A home valued at the median $882,000 would have a property tax bill of $9,369.
San Luis Obispo Sales Tax Rate
The San Luis Obispo sales tax of 8.750% includes the California minimum sales tax of 7.25% — the highest in the nation. However, some cities and counties in CA have sales tax rates up to 10.75%.
California Income Tax
California state income tax rates range from 1% to 12.3% with an extra 1% mental health services tax assessed on income over $1 million. With a highest tax rate of 13.3%, California has the highest income taxes in the country followed by Hawaii (11%) and New Jersey (10.75%).
Cost of Living in San Luis Obispo vs Los Angeles
Trying to decide between living in SLO and Los Angeles? The San Luis Obispo cost of living may be high, but it’s actually more affordable than LA! Here’s how they compare.
| San Luis Obispo | Los Angeles | |
| COLI | 164 | 173 |
| Median home price | $882,000 | $1.02 million |
| Average rent | $2,439 | $2,661 |
| Sales tax | 8.750% | 7.75% |
| Average hourly wage | $27.09 | $30.61 |
| Average weekly wage | $1,071 | $1,382 |
The cost of living in San Luis Obispo, CA may be high, but it’s easy to see why once you’re surrounded by the rolling green hills, enjoying the ideal climate, and spending your weekends exploring vineyards and soaking up the sun at the beach.
Are you ready to make SLO living a reality? Give the best movers in San Luis Obispo a call at Martian Movers to discuss your move and get started with a free, affordable moving estimate!